Sensor logging visualization is not available in Hubitat as the standard functionality. There are some ways to do it. The easiest implementation of the functionality is based on InfluxDB with Grafana. Those products are open-source and they are aimed to build logging visualization. The linking piece to Hubitat is InfluxDB Logger application for Hubitat. Also, it is required a box to install and run InfluxDB and Grafana. If Synology NAS with decent configuration is in place, it might be used to install and run InfluxDB and Grafana. Synology NAS Docker handles InfluxDB and Grafana perfectly for the case. The design is outlined and it is time to follow the steps to accomplish the task of implementation of the functionality.
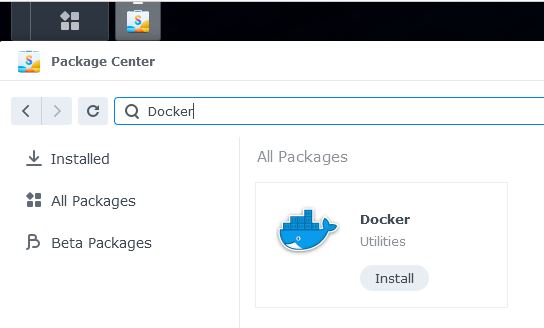
1. Install Docker in Synology NAS from Package Center
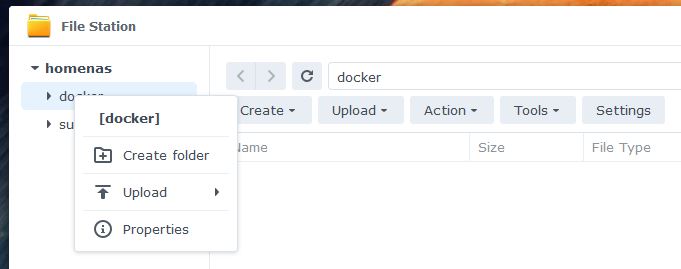
2. Create Subfolder with grafana Name in docker Folder
3. Grant Access for Grafana User to New grafana Folder
Grafana image contains a user with 472 user ID. To make the grafana folder persistent, user with 472 ID must be an owner of the folder.
Enable SSH service
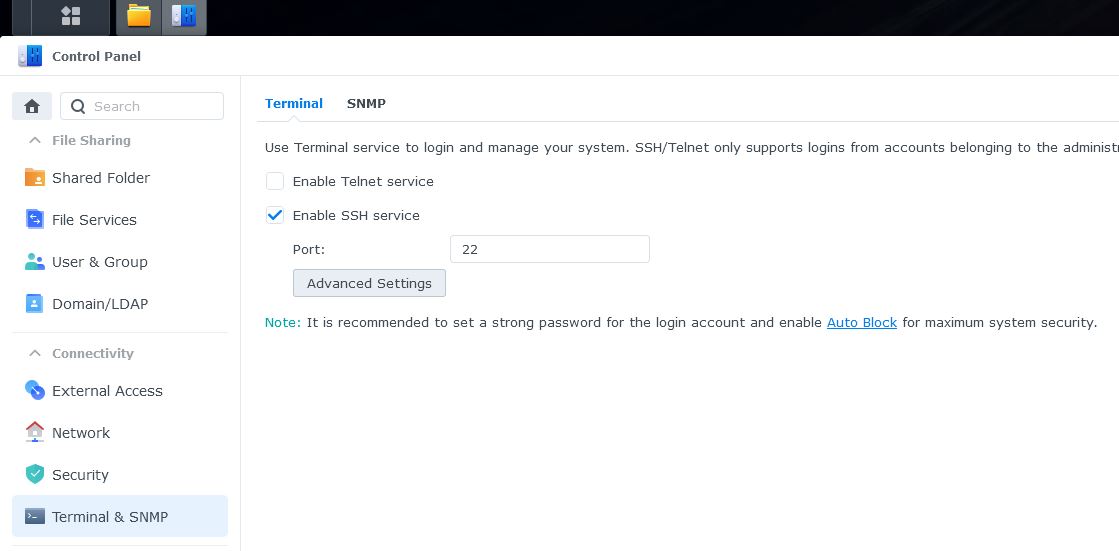
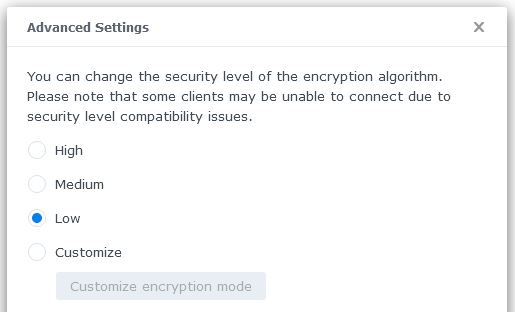
If needed, set security level to Low in Advanced Settings
Open ssh tool, for example, PuTTY, connect to Synology NAS, and run the command
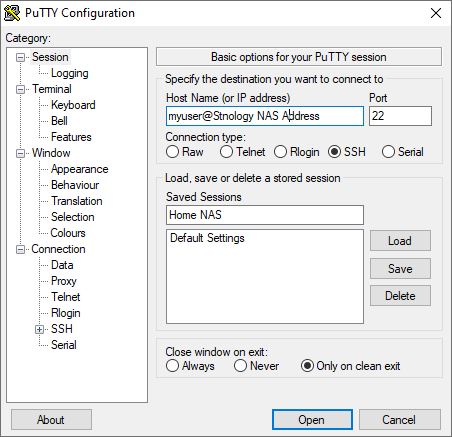
sudo chown -R 472:472 /volume1/docker/grafanaValidate
ls -l /volume1/docker/
drwxrwxrwx+ 1  472  472 0 Oct 29 21:54 grafana
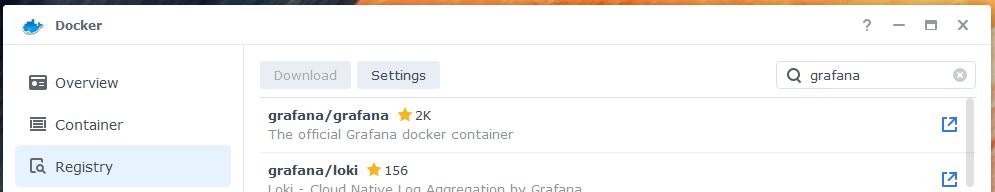
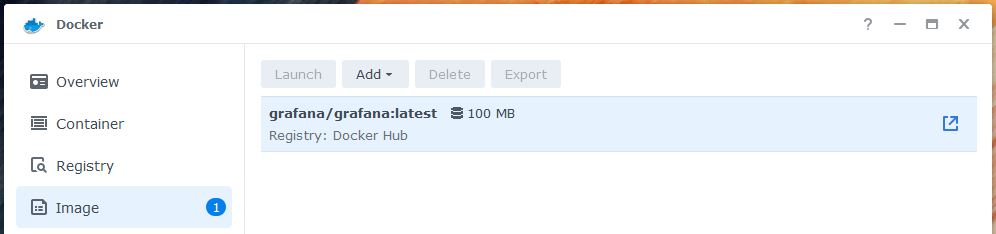
4. Download Latest Grafana Image in Docker
5. Configure Downloaded Grafana Image
Change name to Grafana
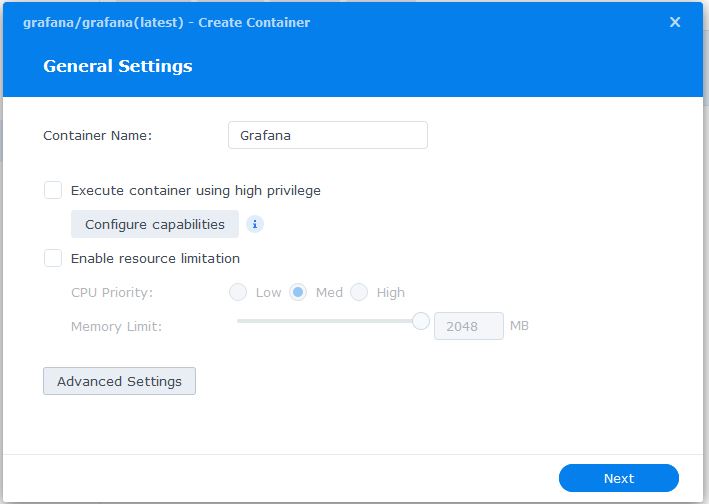
Enable auto-start in Advanced Settings
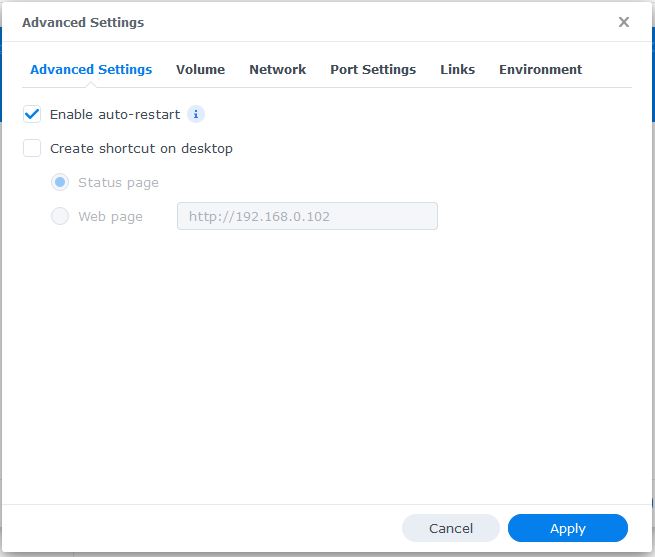
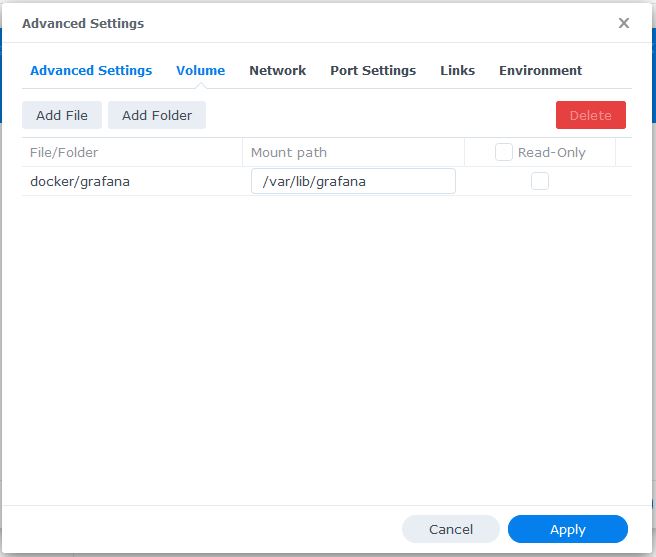
Map grafana folder to /var/lib/grafana Docker image folder in Advanced Settings
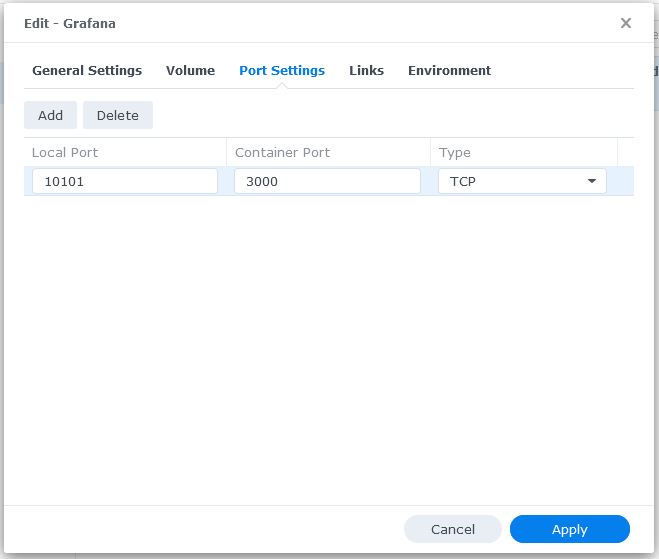
Assign a Grafana port in Advanced Settings
It has to be unoccupied port.
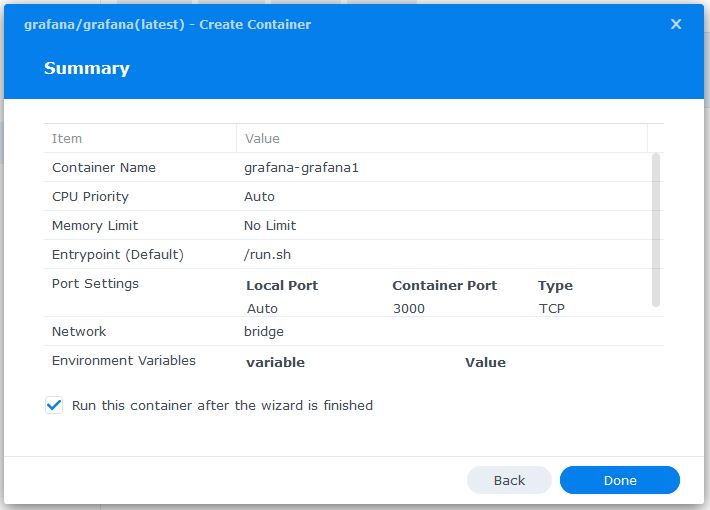
6. Run Grafana container
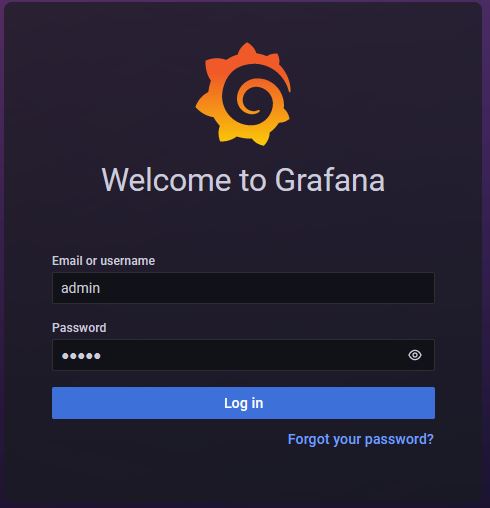
7. Navigate to Grafana Login Page
User name and password is admin. Type [your Synology NAS address]:[Grafana port as per topic #5] in browser.
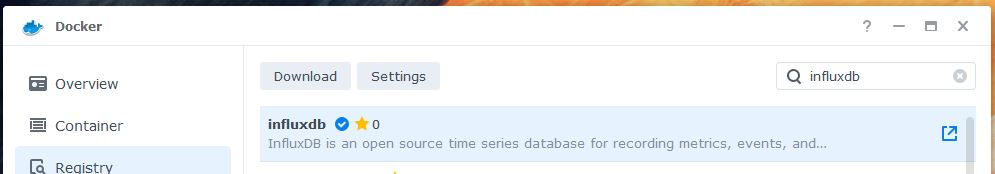
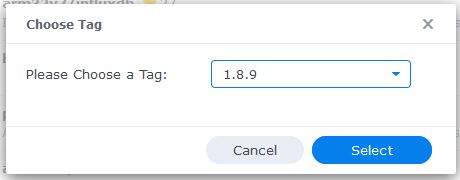
8. Download latest 1.x InfluxDB Image in Docker
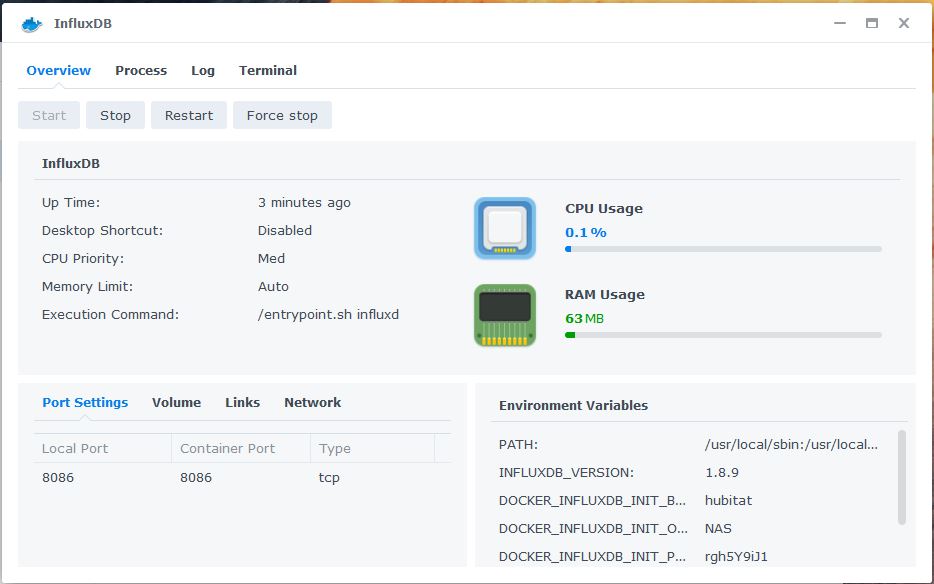
9. Configure Downloaded InfluxDB Image
Change name to InfluxDB
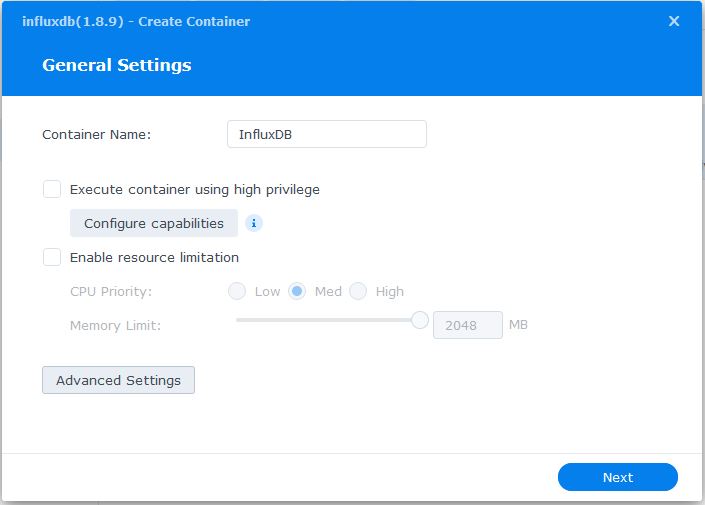
Enable auto-start in Advanced Settings
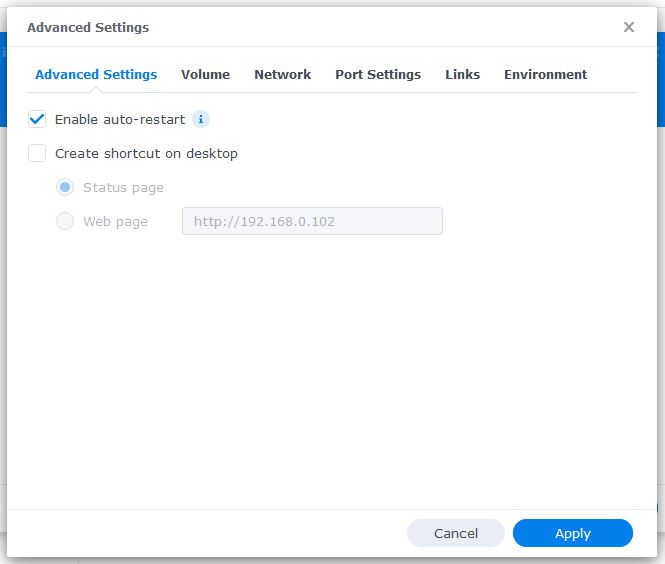
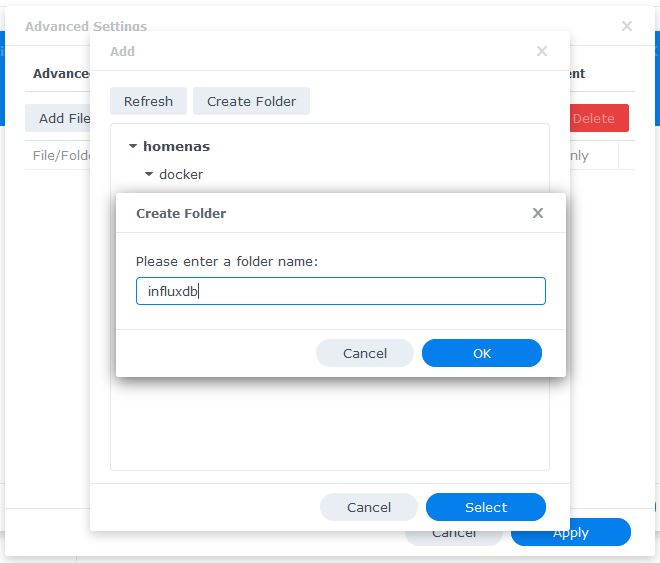
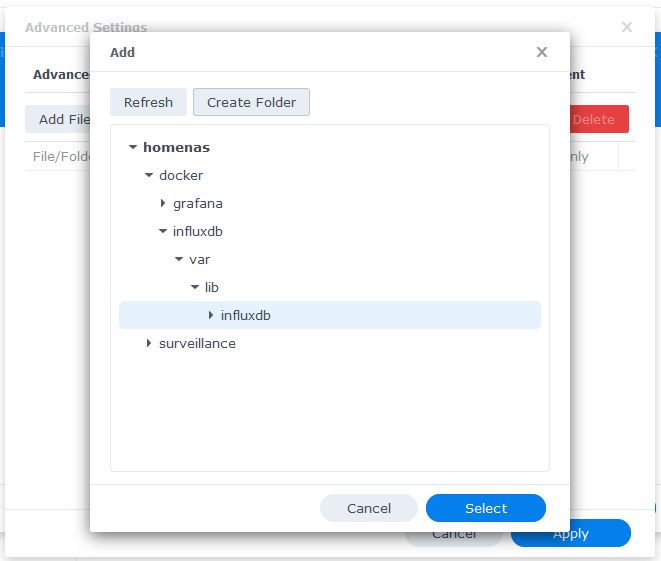
Create InfluxDB folder in docker folder on Volume Tab of Advanced Settings
The folders are influxdb/var/lib/influxdb.
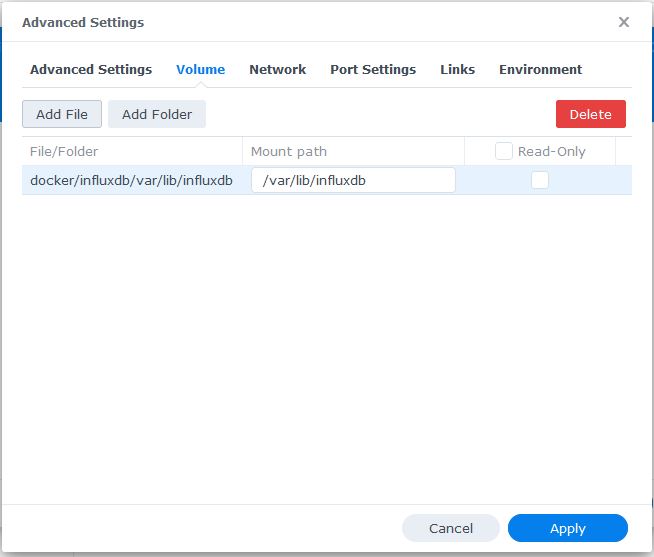
Map InfluxDB folders to /var/lib/influxdb Docker image folder in Advanced Settings
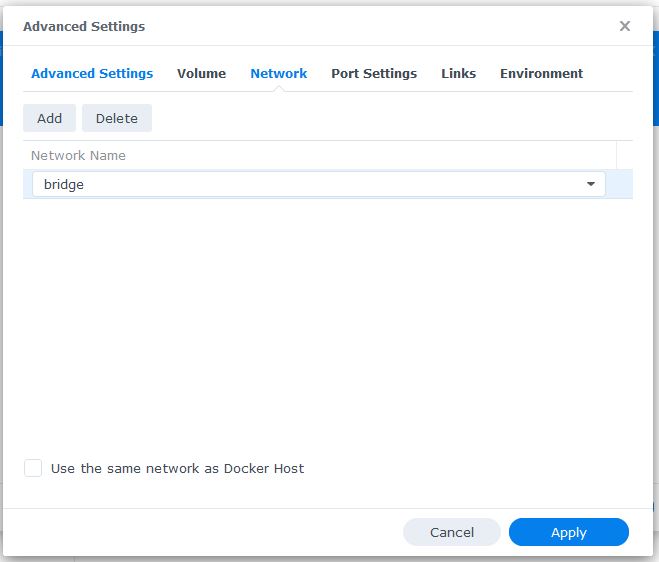
Make sure that Grafana and InfluxDB have the same network
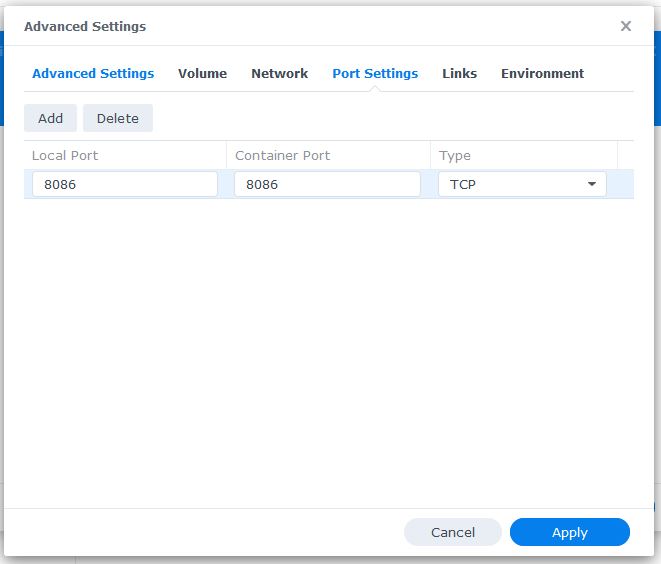
Assign InfluxDB port in Advanced Settings
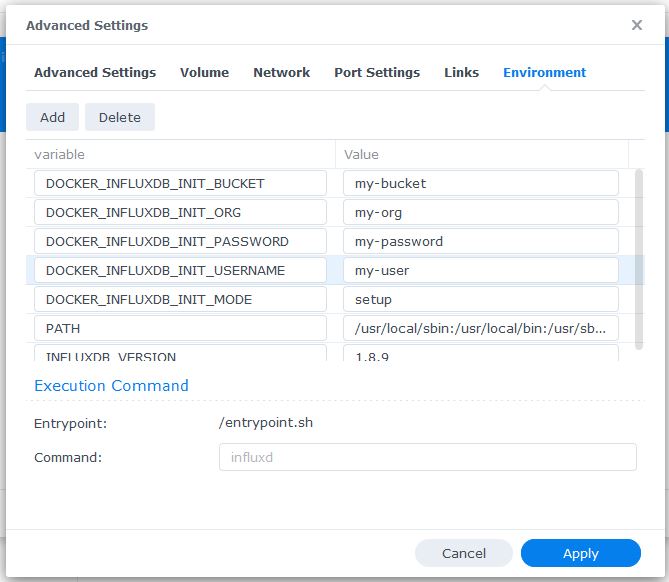
Add environment variables in Advanced Settings
- DOCKER_INFLUXDB_INIT_MODE -> setup
- DOCKER_INFLUXDB_INIT_USERNAME -> my-user
- DOCKER_INFLUXDB_INIT_PASSWORD -> my-password
- DOCKER_INFLUXDB_INIT_ORG -> my-org
- DOCKER_INFLUXDB_INIT_BUCKET -> my-bucket
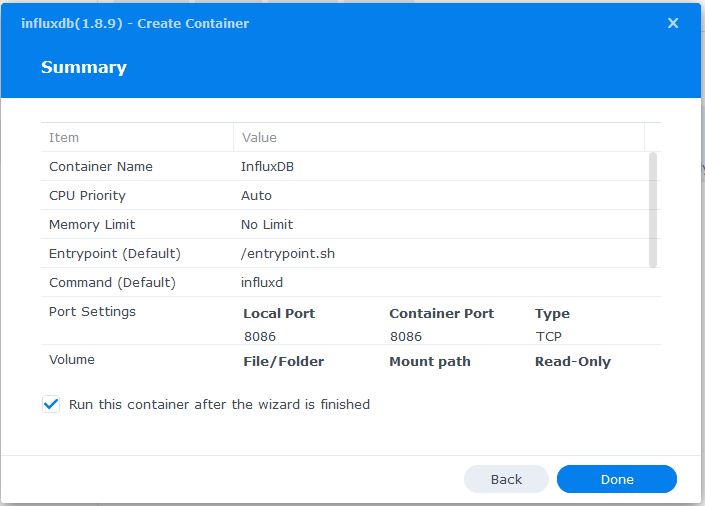
InfluxDB Docker image final step
11. Create Hubitat database
Open InfluxDB container
Go to Terminal
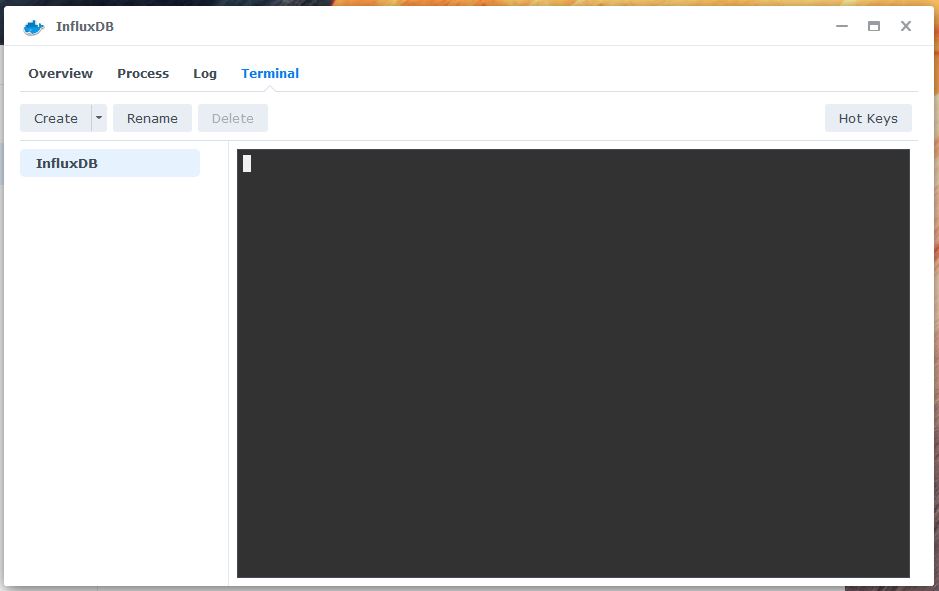
Click Create button and then select bash
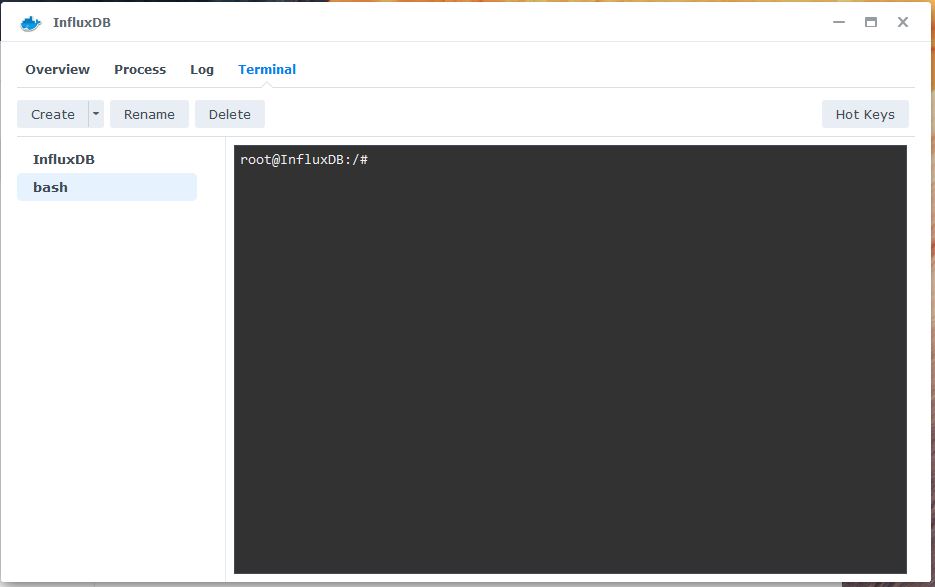
Run influx command
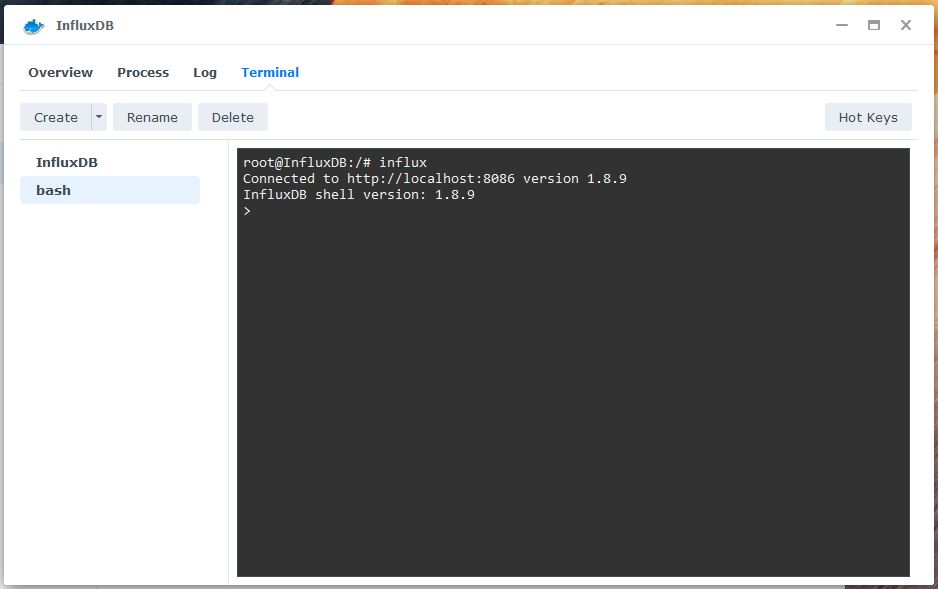
Create Hubitat database
> create database Hubitat
Validate database creation
> show databases
name: databases
name
----
_internal
Hubitat
Exit from InfluxDB
> exit
root@InfluxDB:/#
12. Add Grafana Panel to view Habitat Data
Open Grafana home page entering [your Synology NAS address]:[Grafana port as per topic #5]
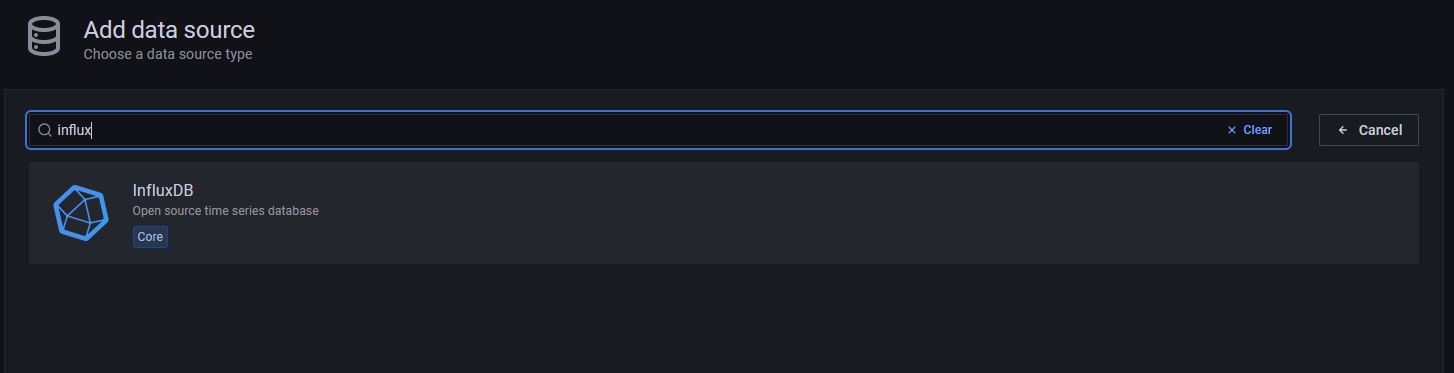
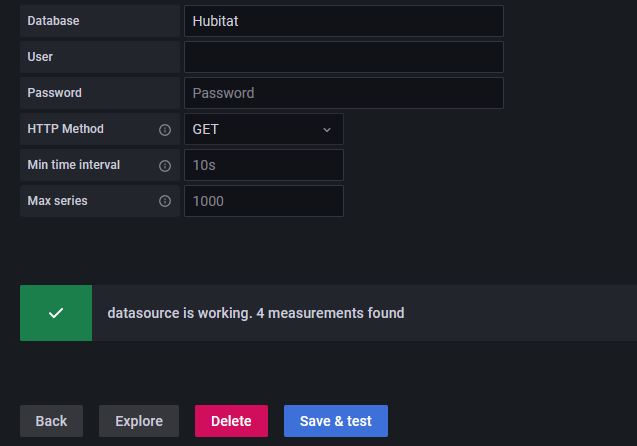
Add data source
Find InfluxDB data source
Replace data source name, URL, and Database
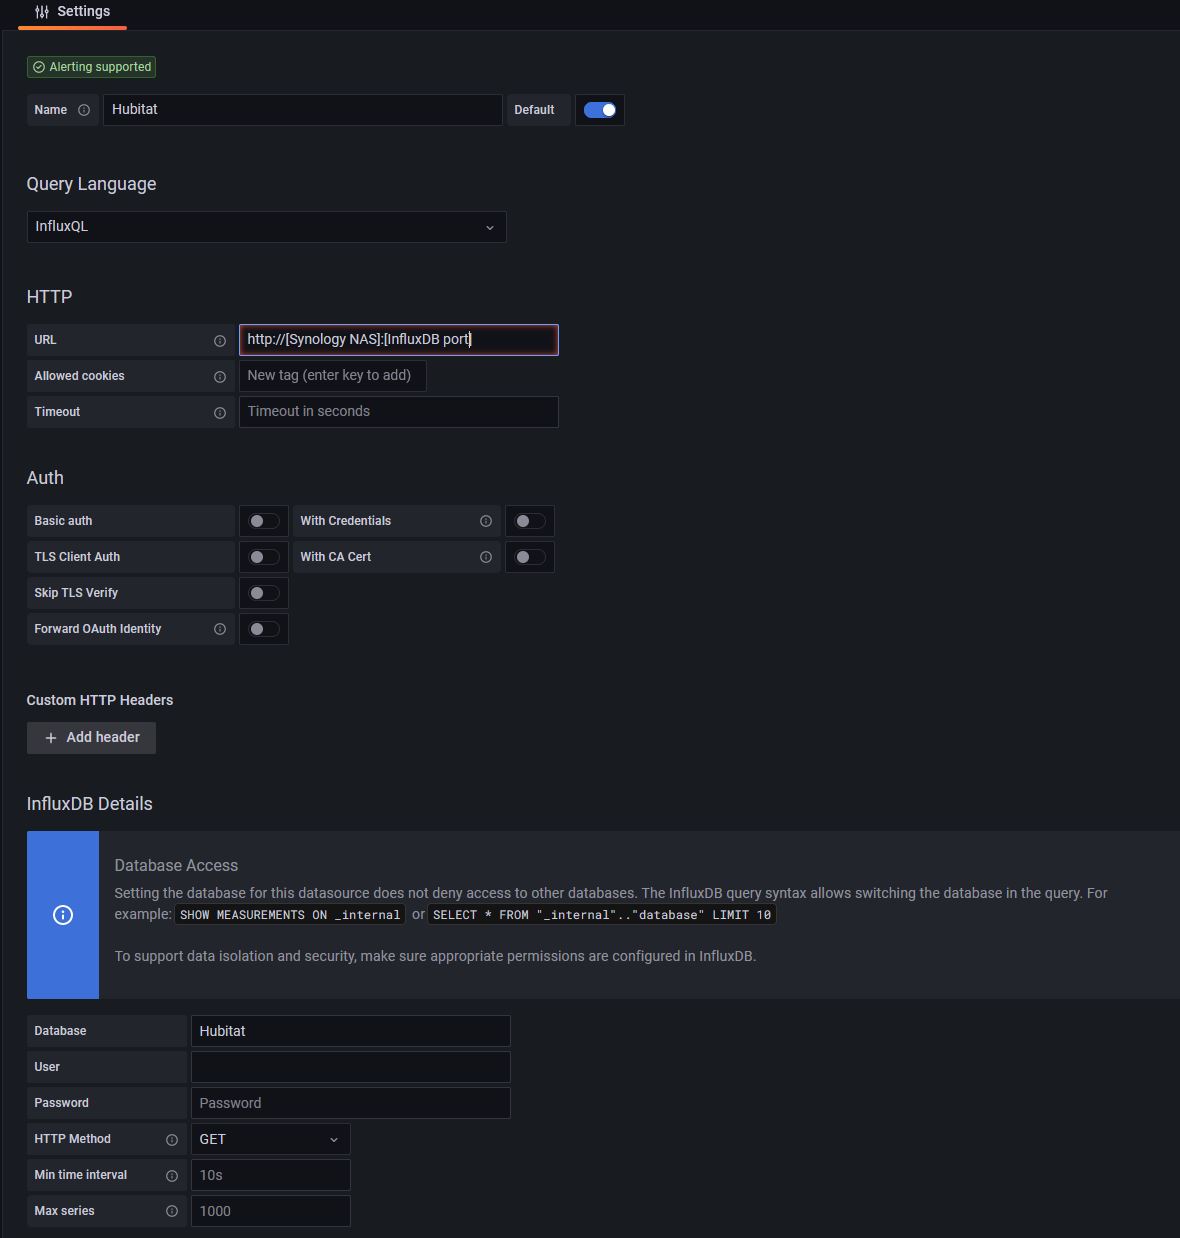
Click Save & Test to get message datasource is working
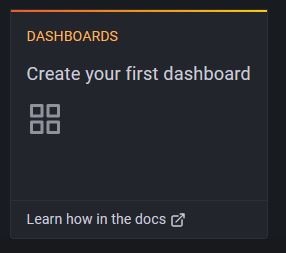
Create new dashboard
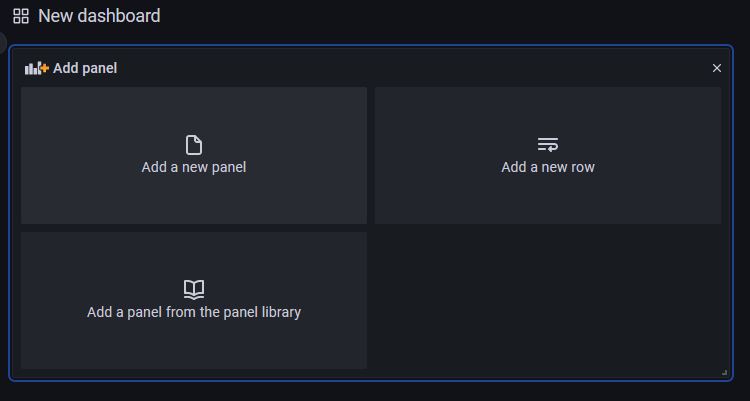
Add new panel
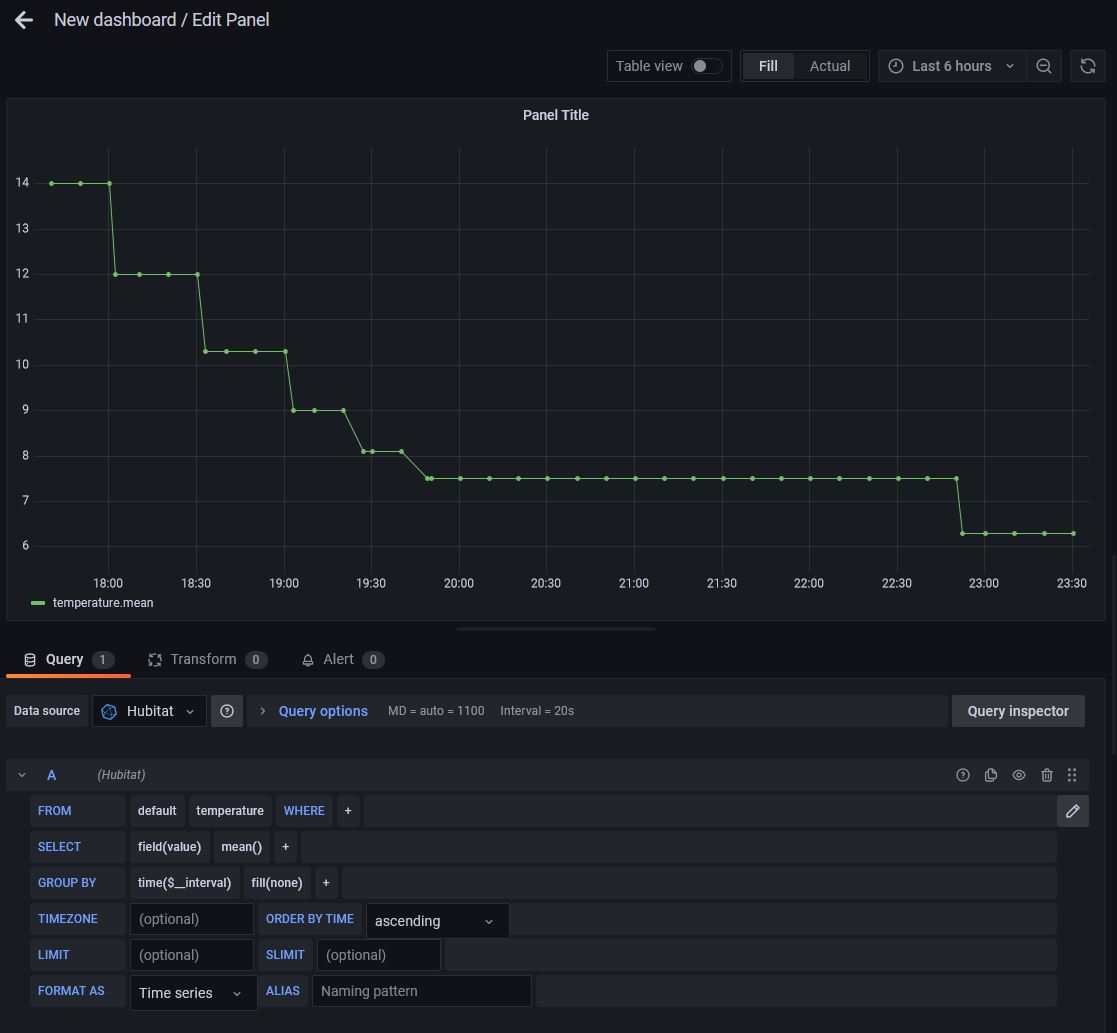
Create query to retrieve data
Comments
comments powered by Disqus